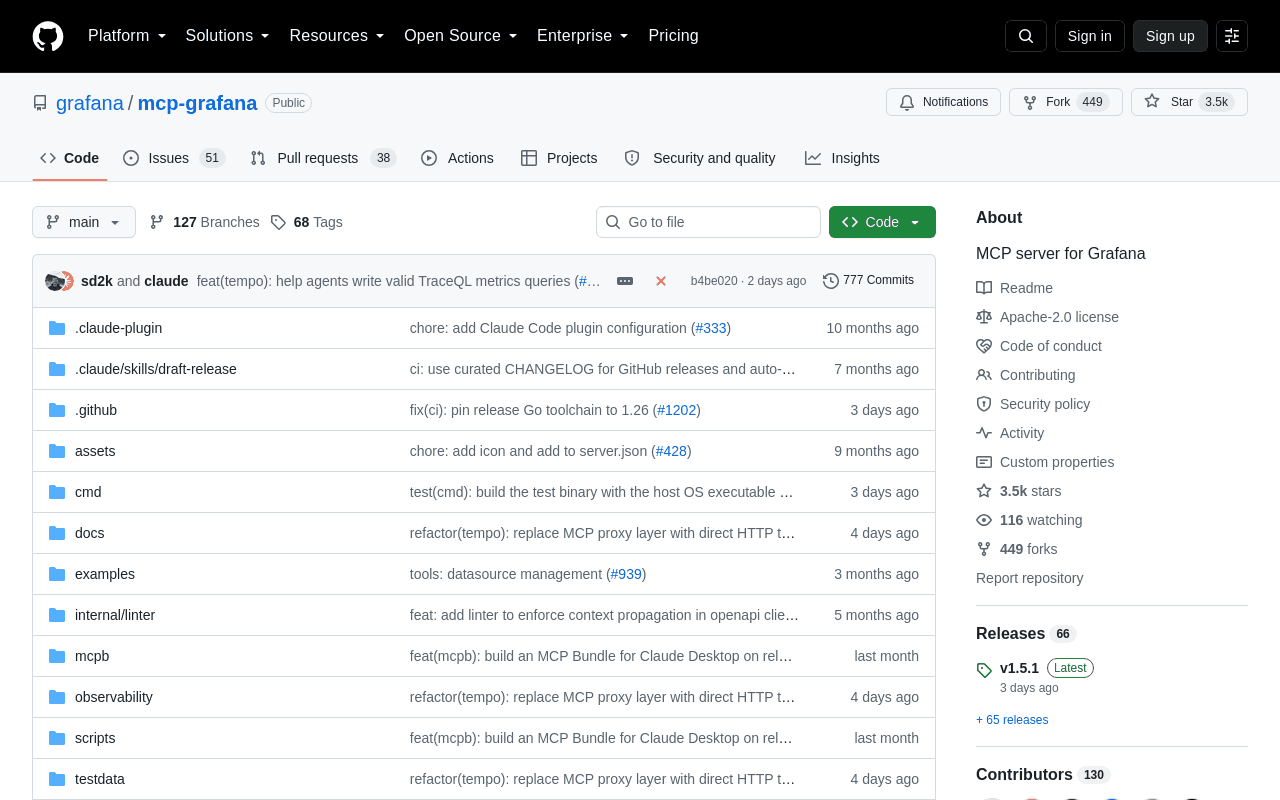
mcp-grafana
An MCP server connecting AI assistants directly to your Grafana instance and its ecosystem.
Data verified Sep 18, 2026
Score
- Try it free
- Free plan
- Best for
- DevOps & SRE Engineers
About mcp-grafana
mcp-grafana is an open-source Model Context Protocol (MCP) server that lets AI assistants like Claude Desktop and Cursor interact with a Grafana instance and its surrounding ecosystem. It exposes tools to search and manage dashboards, run queries against Prometheus, Loki, ClickHouse, CloudWatch and Elasticsearch, handle alert rules, incidents, on-call schedules and Sift investigations, and render panels as images. Built for DevOps and observability engineers, it stands out for its granular context-window management and selective tool toggling that keep AI workflows focused and secure.
Screenshots
Commonly Cited Strengths & Limitations
Strengths
- Granular context-window management for large dashboards
- Selective tool toggling for focused, secure workflows
- Broad datasource and Grafana-ecosystem coverage
- Open source with multiple installation options (uvx, Docker, binary, Helm)
Common Use Cases
- Querying Grafana metrics and logs from an AI assistant
- Managing alert rules and notification policies via AI
- Tracking and creating incidents
- Investigating on-call schedules and alert groups
- Rendering dashboard panels as images for analysis
Details
- Pricing Model
- Free
- Category
- Developer Tools
Who is mcp-grafana for?
DevOps & SRE Engineers
Query metrics and logs, manage alert rules, and track incidents and on-call schedules directly from an AI assistant.
Observability Engineers
Search and inspect dashboards, run Sift investigations, and analyze Pyroscope profiles to troubleshoot performance issues.
Developers
Integrate Grafana into AI-assisted workflows in Claude Desktop or Cursor and selectively enable only the tools they need.
Frequently Asked Questions
Is mcp-grafana free?
Yes, mcp-grafana is free to use.
Does mcp-grafana have an API?
Yes, mcp-grafana provides an API for developers.
Is mcp-grafana open source?
Yes, mcp-grafana is open source.
What does mcp-grafana integrate with?
mcp-grafana integrates with Grafana, Grafana Cloud, Prometheus, Loki, ClickHouse, AWS CloudWatch, Elasticsearch, Grafana Incident, and more.
Is mcp-grafana cloud-based or self-hosted?
mcp-grafana is offered as both cloud and self-hosted (hybrid) deployment.
Who is mcp-grafana best for?
mcp-grafana is best suited for DevOps & SRE Engineers, Observability Engineers, Developers.
What can I use mcp-grafana for?
Common uses for mcp-grafana include querying grafana metrics and logs from an ai assistant, managing alert rules and notification policies via ai, tracking and creating incidents, investigating on-call schedules and alert groups.
How does mcp-grafana compare to IBM API Connect?
mcp-grafana and IBM API Connect are both used for developer tools -- specifically dev infrastructure tools. See the full side-by-side comparison for pricing and feature differences.
Key Features
- Dashboard search and managementFind dashboards by title, folder UID, tag or starred status and retrieve full details, compact summaries, versions, or specific parts via JSONPath.
- Update, create and patch dashboardsModify or create dashboards from full JSON, or apply targeted patches without the full JSON to reduce context window usage.
- Get panel queries and datasource infoExtract the title, query string and datasource UID/type from every panel in a dashboard.
- Run panel queryExecute a dashboard panel's query with custom time ranges and variable overrides (disabled by default, enabled via --enabled-tools).
- Metric and log queriesRun queries against Prometheus, Loki (LogQL), ClickHouse, CloudWatch and Elasticsearch datasources.
- Alert rule managementList, create, update and delete alert rules and manage notification policies, contact points and time intervals.
- Incident trackingList, create and update incidents in Grafana Incident and add activity items.
- On-call managementList OnCall schedules, teams, users, shifts and alert groups and see who is currently on call.
- Sift investigationsRetrieve Sift investigations and analyses and find error patterns or slow requests in logs and traces.
- Pyroscope profilingList profile types and labels and fetch profiles in DOT format for analysis.
- Panel image renderingRender a dashboard panel or full dashboard as a PNG image.
- AnnotationsFetch, create and update Grafana annotations and list annotation tags.
- Context window managementCompact summaries, JSONPath property extraction and patching strategies minimize context window consumption on large dashboards.
- Selective tool togglingTurn specific tools on or off to keep the workflow focused and secure.
Integrations
Technical Details
- Deployment
- Hybrid
- Target Market
- B2B
- API
- Available
- Free Plan
- Available
Real Pricing from Verified Users
See what people actually pay for mcp-grafana
Reviews
0 reviews
No reviews yet. Be the first to share your experience!
Switching Stories
Real migration experiences with mcp-grafana
Discussion
Ask questions, share tips, or discuss this tool with other users.
No discussion yet. Start the conversation!
Similar tools in Developer Tools
Other listed tools in Developer Tools, not reviewed as direct alternatives

Full lifecycle API management to create, secure, manage, and socialize APIs across clouds.
Also Dev Infrastructure Tools
- API Design
- API Lifecycle Management
- API Gateway
Link management with branded links, QR codes, UTM tools and deep linking
Also Analytics & BI Tools
- Branded links
- Branded QR codes
- Conversion tracking
- Branded short links
- Access controls
- Targeting

- Payment Gateway
- Payment Button
- Payment Links

- Mixpanel AI
- AI Data Governance
- Analytics

- GitHub Copilot
- GitHub Actions
- GitHub Codespaces
Also used for
More from github.com


People Also Viewed




More in Developer Tools
The platform for smart business apps


The agentic IDE powered by Codeium AI

Prompt, run, edit & deploy full-stack apps in the browser